Is your database fully using your hardware? Probably not!
Lately I've been thinking about this notion of operational intensity (2), and it occurred to me that it's completely missing from the database community. The first advice the HPC people always give is: compute a roofline of your workload, and then ensure your implementation meets it. And yet somehow this methodology is missing from the database world!
Usually people benchmark their data analytics system on TPC-H, a standard set of 22 SQL queries over a standard set of 8 tables. The size of the tables changes based on the scale factor (SF). For example, SF1 corresponds to a 1 GB CSV file and SF1000 corresponds to a 1TB CSV file. The age-old game is to make your system run the queries faster and write a sweet blog post about it. But as the authors of (1) note, that's almost never a fair comparison.
But taking a step back, why are we even comparing different systems against each other? What does it mean to be fast, in the absolute sense? Merely comparing two systems tells us which is faster, but not which is fast. No database benchmark I've seen compares itself to the roofline, and so we don't even know what to target.
The roofline performance can be calculated using the operational intensity. Operational intensity is simply the ratio of operations performed to bytes scanned from memory. 1 Once data is in the cache, we don't consider it again.
Operational intensity lets us determine if our query is memory-bound or compute-bound. If our computer can do \(P\) ops/sec and has \(B\) bytes/sec of memory bandwidth, and our query has an operational intensity of \(I\), then if \(I > \frac{P}{B}\), the query is compute-bound, and otherwise it's memory-bound.
Computing the operational intensity of a query is straight-forward: take a physical query plan and count up the number of operations per row. Similarly, measure the number of bytes scanned, and divide them. For example, here is my calculation of the operational intensity of TPC-H Q1:
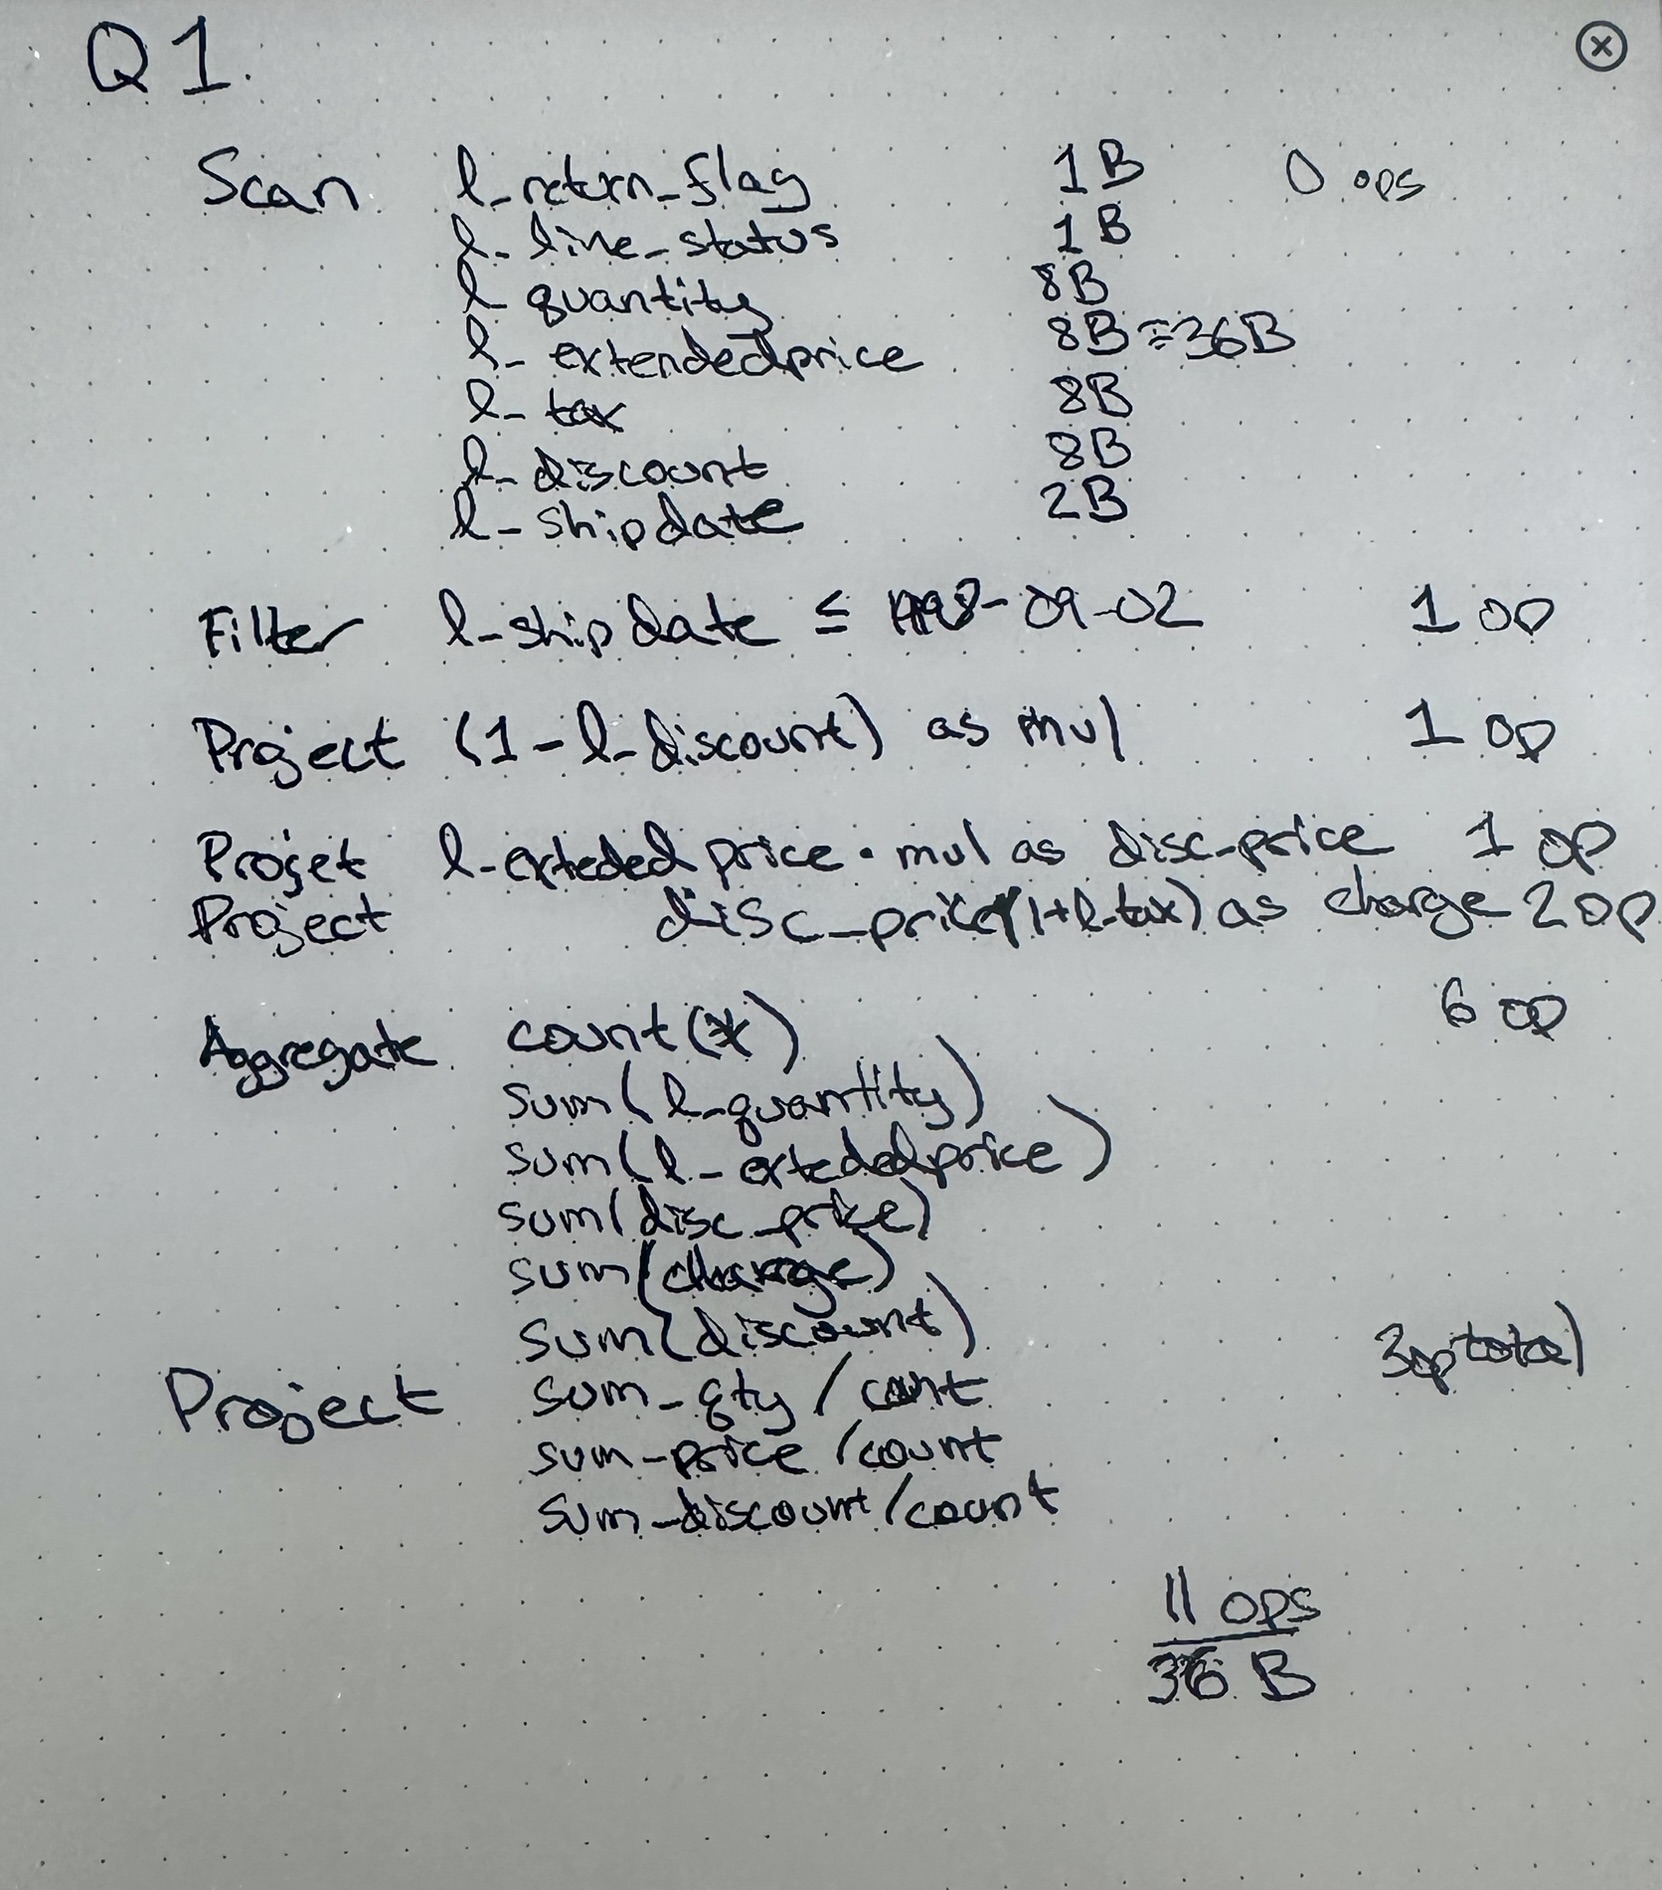
My machine has \(130\) GB/s of memory bandwidth and has four ALUs per core clocking at $4$GHz with \(24\) cores. With \(B = 130 \cdot 10^9\) and \(P = 24 \cdot 4 \cdot 4 \cdot 10^9 = 384 \cdot 10^9\), \(\frac{P}{B} = \frac{384}{130} = 2.95\). According to my above calculation, \(I = \frac{11}{36} \approx 0.31\) which is much less than \(2.95\). So we expect this query plan to be memory-bound, and run at my bandwidth of \(130\) GB/s. Notice that the maximum operations-per-second is equal to \(B \cdot I = 130 \cdot 10^9 \cdot \frac{11}{36} \approx 39.7 \cdot 10^9\), meaning only \(\frac{39.7}{4 \cdot 4} \approx 2.5\) cores is sufficient to handle this query.
The Lineitem table at scale factor 100 has \(600,037,902\) rows, corresponding to \(20.12\) GB scanned (with the 36 bytes/row computed above). DuckDB executes the query in 0.4 sec, indicating a speed of approximately \(80\) GB/s, well below the theoretical \(130\) GB/s 2.
The story doesn't end here. In my next post, I'll talk about what can be done to shift the balance between memory bandwidth and operations to more closely match the machine (spoilers: compression and SIMD).
References
[1] Mark Raasveldt and Pedro Holanda and Tim Gubner and Hannes M{\"u}hleisen, Fair Benchmarking Considered Difficult, 2018.
[2] Samuel Williams and Andrew Waterman and David Patterson, Roofline, Communications of the ACM, 2009.
Footnotes:
Operational intensity is subtly different from arithmetic intensity, which is popular in Machine Learning. Arithmetic intensity includes the data scanned from caches, while operational intensity only includes DRAM (2)
Though in fairness to DuckDB, they're probably aiming to saturate SSD bandwidths, which are around \(4.5\) GB/s.